
Updated: May 15

The S&P 500 (the ‘S&P’) has been on a tear in recent years.  During the 10-year period ending March 31, 2024, the S&P averaged 13.0% per year (including dividends).  That is a great return.  With the exception of the NASDAQ, it’s beaten nearly every benchmark out there.  As we noted in a year-end letter to clients in December: “Consequently, any equity portfolio holding something other than US large cap stocks has likely not performed as well as the S&P.  That has been the curse of diversification over the past few years.”

So, what happens next?  Why not just put everything into the S&P today?  It’s done so well, right?  It has.  And that’s kind of the problem.

Because it’s done so well recently, the odds of a repeat performance (another 13% per year for the next ten years), at least in our view, are low.  In fact, I think a reasonable expectation for what we’ll get over the next 10 years (starting on April 1, 2024) on the S&P is somewhere between 4% and 7%.  I’ll explain why below.

But first, some background.

Stock returns (whether an individual stock or an index) come from the combination of three things:

  1. Dividends
  2. Growth in earnings per share, and
  3. The change in the valuation attached to those earnings, measured by the change in the PE ratio
That third item, the PE ratio, requires a bit of explanation.  The PE ratio is just the current price divided by the last 12 month’s earnings.  It can be affected by a variety of things (e.g., market psychology, interest rate expectations, perceived business risk) but generally interpreted as the market’s expectations for future earnings growth.  If the PE ratio is high, growth expectations are generally high.  If the PE ratio is low, growth expectations are generally low.
The PE ratio is kind of the wild card in our little returns equation above.  When it goes up, it helps returns and when it goes down it hurts them.  There’s a catch though.  the PE ratio cannot go forever up or forever down.  It moves in a range.   And it tends to be mean reverting.
Over the long term, what the PE ratio giveth, the PE ratio tend to taketh away (and vice versa, of course).
So, what did the S&P PE ratio do over the past 10 years?  It increased from about 18 to about 27[1].  That helped returns a lot.  In fact, I estimate that about one third of the 13% return on the S&P over the past 10 years came courtesy of that increasing PE ratio.  Not dividends.  Not earnings growth.  Just increasing valuations.
The PE ratio has been in giveth mode over the past decade.
Here’s why that’s not likely to continue:
Remember our formula above: returns = dividends + earnings per share growth + PE ratio change (this sum is not exact due to the math of compounding, but I’ve corrected for that in my calculations). Let’s use that formula to see what the PE ratio would have to be 10 years from now to get another 13% per year return over the next decade starting April 1st this year.
The current dividend yield on the S&P is about 1.4%.  That’s a reasonable estimate for what we should expect from dividends over the next 10 years.
The S&P’s earnings per share (including inflation) grew a bit less than 7% per year over the past decade so let’s assume we get 7% over the next 10 years (which, incidentally, would be very good – I’ll return to this point at the end).
Add those two and you would get returns of about 8.4% over the next decade.  But wait, we want 13%!  That means we need an increasing PE ratio.
To get 13%, the S&P PE ratio would need to go from about 27 today to about 41 ten years from now.  How likely is that? The only time the S&P PE ratio has been above that in the past 35 years is in the aftermath of the tech bubble in the early aughts and the aftermath of the Great Financial Crisis in 2008-2009.
What if, instead, the PE ratio goes down over the next 10 years?  Let’s say it comes back to a more normal-ish value of 20 ten years from now.  If that happens, your total return over the next 10 years on the S&P would be about 5.2%.  By the way, I picked 20 because about 70% of the time over the past 35 years it’s been between 15 and 25.
Now, could PE ratios stay higher for the long term?  Of course. There are good arguments for this (think tech-enabled business models here: less capital intensive, higher return on equity).  But assuming they stay higher is a bet against history.  Who wants to take those odds?
Let’s look at another measure.  Check out the following chart of the Shiller Cyclically Adjusted PE ratio over the past 20 years.  The Shiller PE is a widely used modification of the traditional PE ratio meant to average out the short-term noise of earnings volatility associated with business cycles.  Like the normal PE ratio, the Shiller PE moves in a range (i.e., it doesn’t go up or down forever, and it tends to be mean reverting).

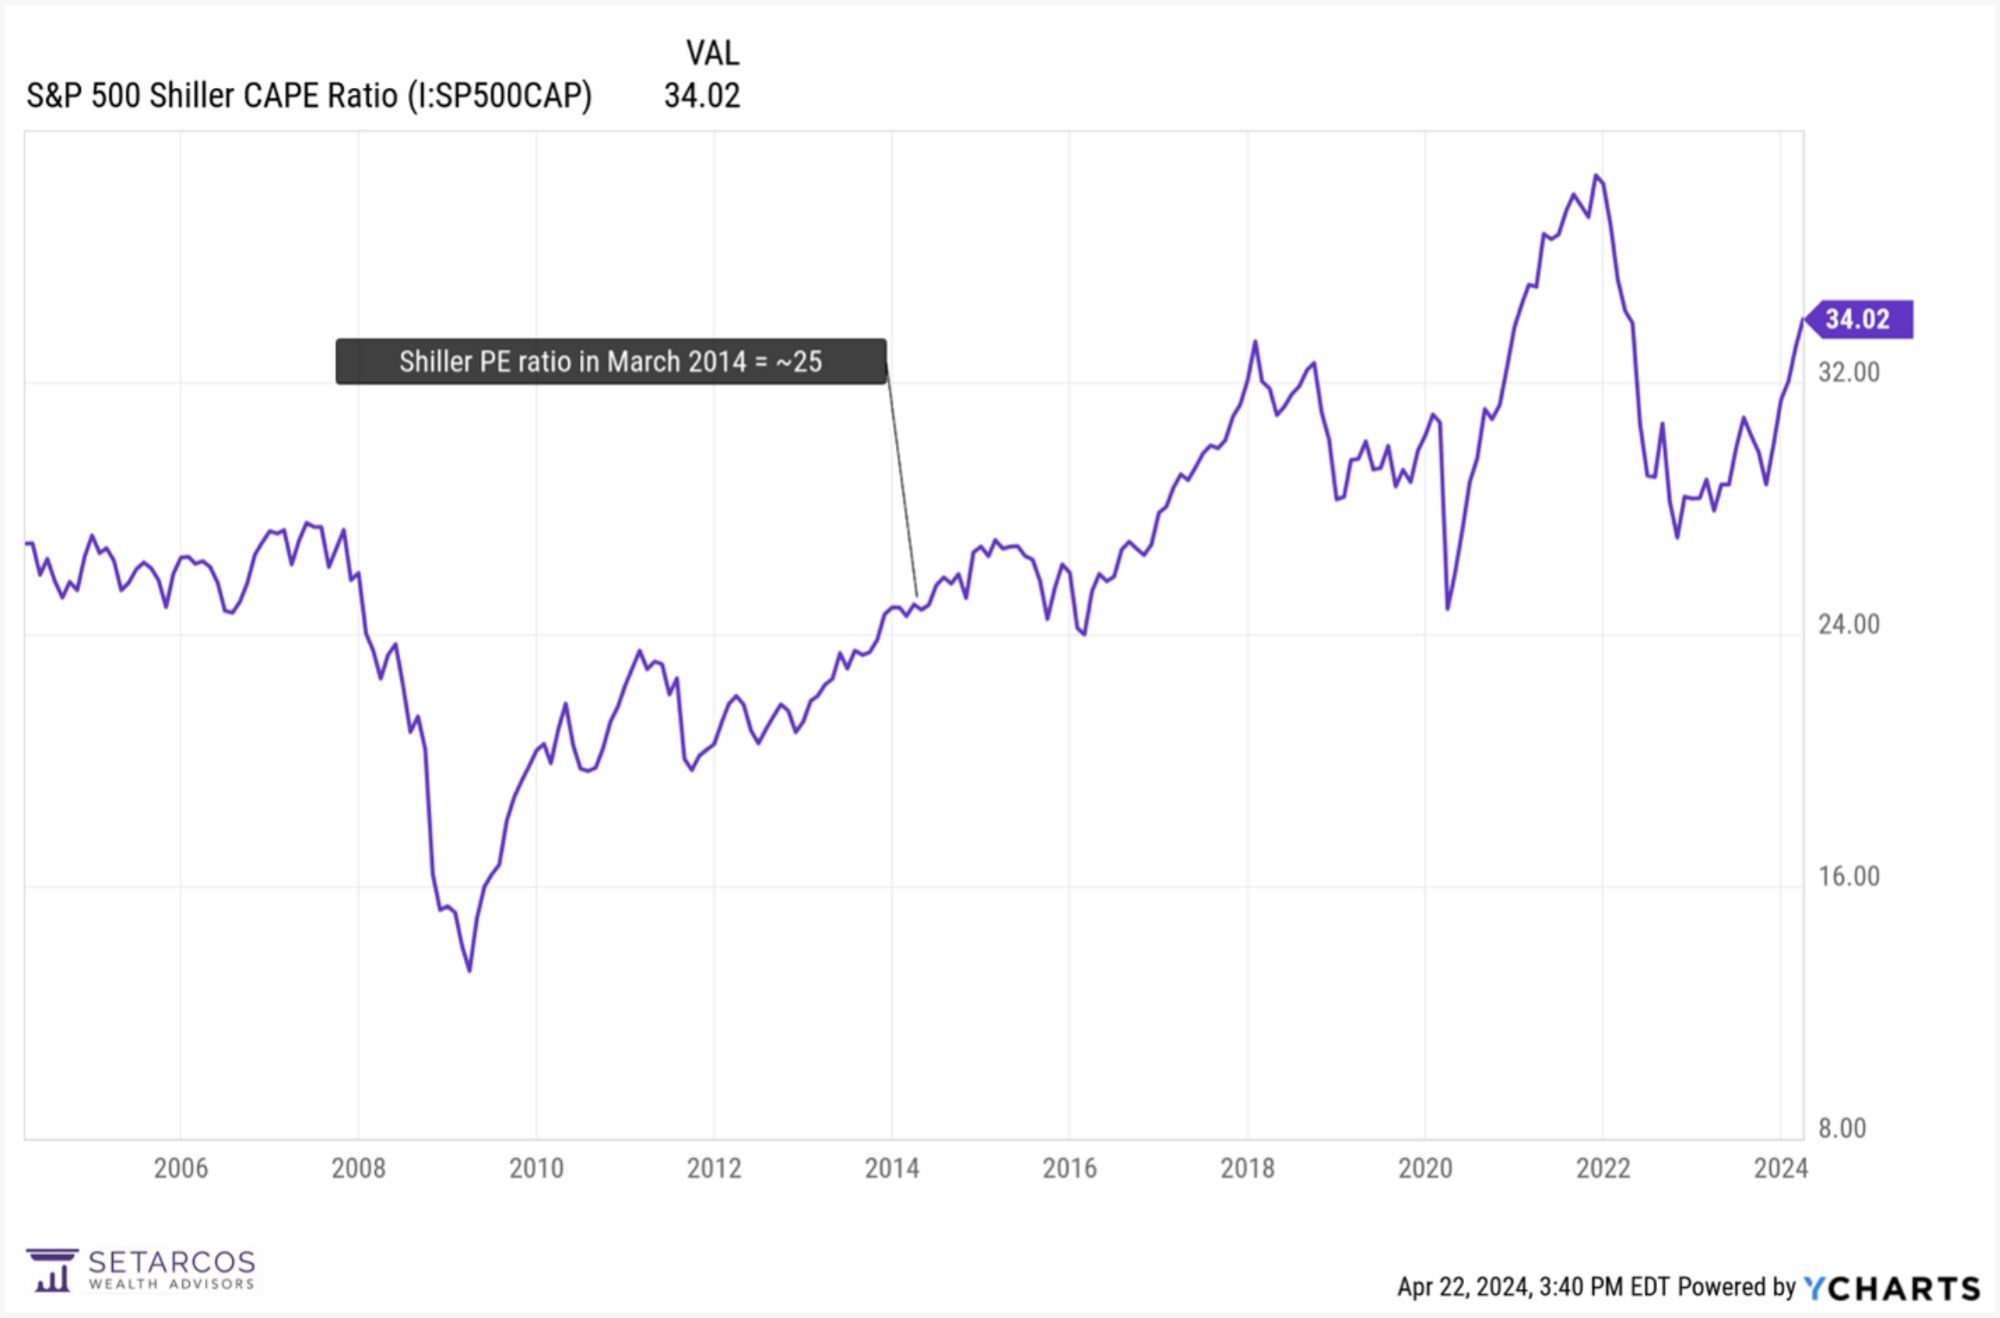
Note where the Shiller PE is as of March 2024 compared to where it was 10 years ago.  It’s increased from about 25 to about 34.  Over the past 140 years or so (yes, 140 years), the Shiller PE has been higher than it was on March 31, 2024 on only two other occasions: in 2021 and in the late 90s tech bubble (not shown in the chart).

What would the Shiller PE ratio have to be 10 years from now for us to get another 10 years of 13% annual returns from here?  Let’s use the same assumptions as above: dividend yield of 1.4% and earnings growth of 7%.  We also have to make an inflation assumption for the Shiller PE ratio calculation, so I’ve assumed 2.5% per year.

Based on my calculations, to get 13% over the next 10 years would require the Shiller PE ratio to hit about 50 ten years from now.

It’s never hit that level.  Not in 140 years.  Not even in the 90s tech bubble (which was the highest it ever hit).  Still, is it possible?  Yes.  Is it likely?  Do I need to answer that?

What if the Shiller PE ratio comes back down to something a little more normal (by recent historical standards)?  Let’s assume it’s at 25 ten years from now.  If that happens (and using the same dividend and earnings growth assumptions from above), the total annual return on the S&P over the next ten years would be about 5.5% (very close to our estimate using the normal PE).

At this point, it might be tempting to say, ‘well, fine, I get that valuations are high, but I think earnings will grow faster than 7%’.  Maybe, but I think that’s unlikely also.  Corporate profits are a component of GDP and those are already near historically high levels as a percent of GDP.  To have those grow faster, you need GDP to grow faster and/or to have profits become an even greater proportion of GDP.  Seems unlikely.

If you’d like just one more data point to chew on, consider this historical tidbit: over the past 30 years, if we look at all of the periods in which the S&P returned 12% or more over any consecutive 120 month period, and then, for those periods, look to see what the S&P returned over the next 10 years, we find the following: the average annual return for those subsequent periods was just 1.6%.  And the very best was 7.7%.

The S&P had a great run over the past decade.  Just don’t expect a repeat.

To be clear, I’m not saying it can’t happen.  Just that it’s not likely.

You know, math and history and all.

[1] I’ve used estimated earnings per share for Q1 of this year (source: S&P) in all calculations since actual results for Q1 have not yet been fully reported.

Disclosures:

The information provided is for educational and informational purposes only and does not constitute investment advice and it should not be relied on as such. It should not be considered a solicitation to buy or an offer to sell a security. It does not take into account any investor’s particular investment objectives, strategies, tax status or investment horizon. You should consult your attorney or tax advisor. The views expressed in this commentary are subject to change based on market and other conditions. These documents may contain certain statements that may be deemed forward‐looking statements. Please note that any such statements are not guarantees of any future performance and actual results or developments may differ materially from those projected. Any projections, market outlooks, or estimates are based upon certain assumptions and should not be construed as indicative of actual events that will occur. All information has been obtained from sources believed to be reliable, but its accuracy is not guaranteed. There is no representation or warranty as to the current accuracy, reliability or completeness of, nor liability for, decisions based on such information and it should not be relied on as such. Index returns are unmanaged and do not reflect the deduction of any fees or expenses.  Index returns reflect all items of income, gain and loss and the reinvestment of dividends and other income.  You cannot invest directly in an Index. Past performance shown is not indicative of future results, which could differ substantially. No investment strategy or risk management technique can guarantee returns or eliminate risk in any market environment. All investments include a risk of loss that clients should be prepared to bear. The principal risks of Setarcos strategies are disclosed in the publicly available Form ADV Part 2A.
Setarcos Wealth Advisors LLC (“Setarcos”) is a registered investment advisor. Advisory services are only offered to clients or prospective clients where Setarcos and its representatives are properly licensed or exempt from licensure. For additional information, please visit our website at setarcosllc.com.

© Copyright 2024 Setarcos LLC

Legal

Disclosures
Privacy Policy
Form ADV
Sitemap

Links

Services
About
Working With Us
Team
FAQ
Insights
Contact