Updated: May 15
The S&P 500 (the ‘S&P’) has been on a tear in recent years. During the 10-year period ending March 31, 2024, the S&P averaged 13.0% per year (including dividends). That is a great return. With the exception of the NASDAQ, it’s beaten nearly every benchmark out there. As we noted in a year-end letter to clients in December: “Consequently, any equity portfolio holding something other than US large cap stocks has likely not performed as well as the S&P. That has been the curse of diversification over the past few years.”
So, what happens next? Why not just put everything into the S&P today? It’s done so well, right? It has. And that’s kind of the problem.
Because it’s done so well recently, the odds of a repeat performance (another 13% per year for the next ten years), at least in our view, are low. In fact, I think a reasonable expectation for what we’ll get over the next 10 years (starting on April 1, 2024) on the S&P is somewhere between 4% and 7%. I’ll explain why below.
But first, some background.
Stock returns (whether an individual stock or an index) come from the combination of three things:
- Dividends
- Growth in earnings per share, and
- The change in the valuation attached to those earnings, measured by the change in the PE ratio

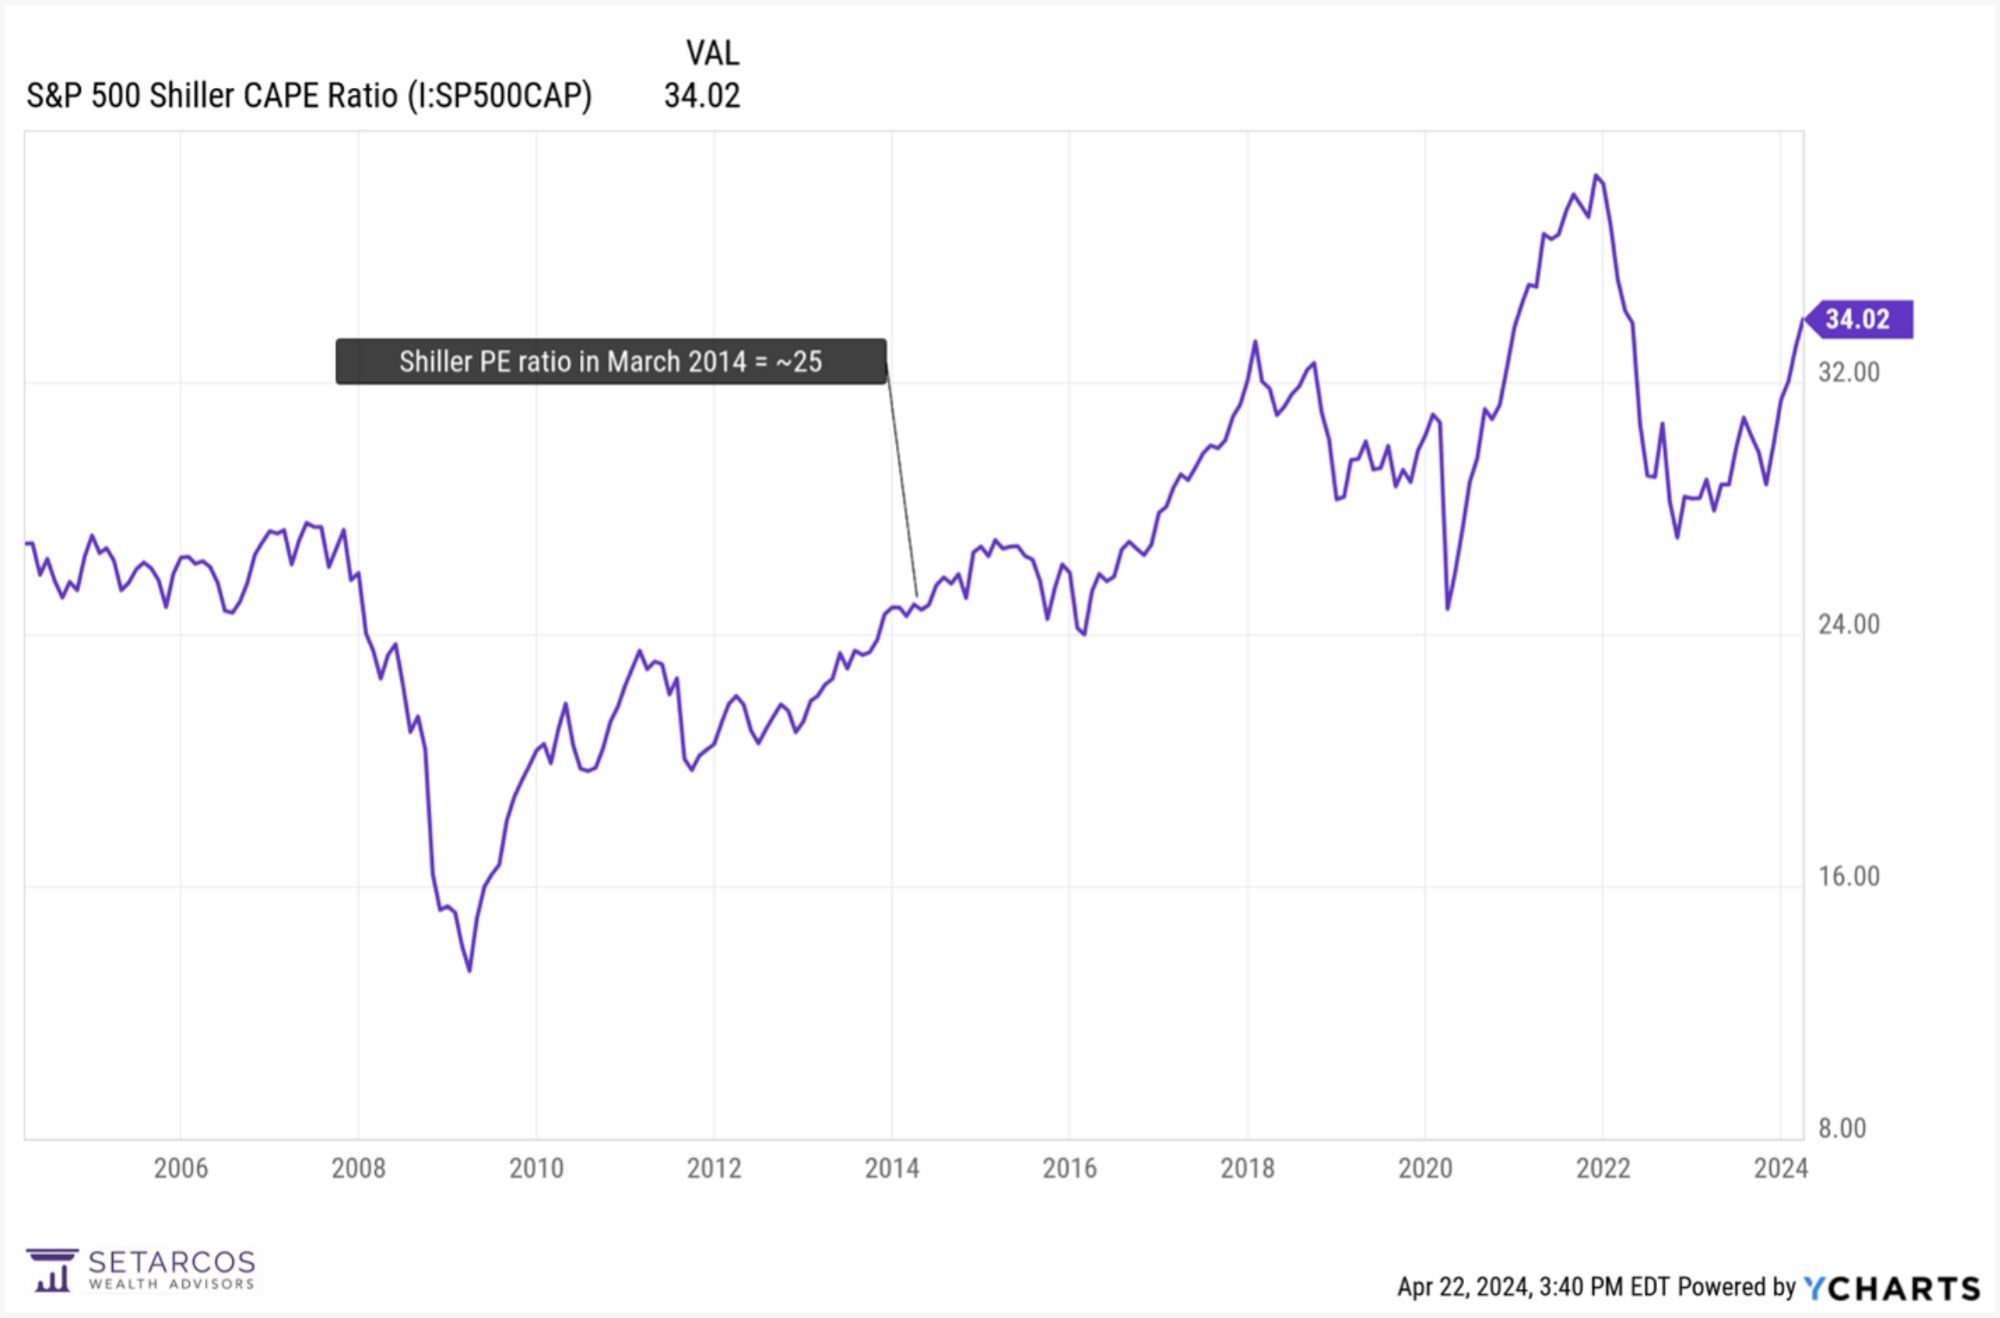
Note where the Shiller PE is as of March 2024 compared to where it was 10 years ago. It’s increased from about 25 to about 34. Over the past 140 years or so (yes, 140 years), the Shiller PE has been higher than it was on March 31, 2024 on only two other occasions: in 2021 and in the late 90s tech bubble (not shown in the chart).
What would the Shiller PE ratio have to be 10 years from now for us to get another 10 years of 13% annual returns from here? Let’s use the same assumptions as above: dividend yield of 1.4% and earnings growth of 7%. We also have to make an inflation assumption for the Shiller PE ratio calculation, so I’ve assumed 2.5% per year.
Based on my calculations, to get 13% over the next 10 years would require the Shiller PE ratio to hit about 50 ten years from now.
It’s never hit that level. Not in 140 years. Not even in the 90s tech bubble (which was the highest it ever hit). Still, is it possible? Yes. Is it likely? Do I need to answer that?
What if the Shiller PE ratio comes back down to something a little more normal (by recent historical standards)? Let’s assume it’s at 25 ten years from now. If that happens (and using the same dividend and earnings growth assumptions from above), the total annual return on the S&P over the next ten years would be about 5.5% (very close to our estimate using the normal PE).
At this point, it might be tempting to say, ‘well, fine, I get that valuations are high, but I think earnings will grow faster than 7%’. Maybe, but I think that’s unlikely also. Corporate profits are a component of GDP and those are already near historically high levels as a percent of GDP. To have those grow faster, you need GDP to grow faster and/or to have profits become an even greater proportion of GDP. Seems unlikely.
If you’d like just one more data point to chew on, consider this historical tidbit: over the past 30 years, if we look at all of the periods in which the S&P returned 12% or more over any consecutive 120 month period, and then, for those periods, look to see what the S&P returned over the next 10 years, we find the following: the average annual return for those subsequent periods was just 1.6%. And the very best was 7.7%.
The S&P had a great run over the past decade. Just don’t expect a repeat.
To be clear, I’m not saying it can’t happen. Just that it’s not likely.
You know, math and history and all.
[1] I’ve used estimated earnings per share for Q1 of this year (source: S&P) in all calculations since actual results for Q1 have not yet been fully reported.
Disclosures:


